Gathering Runtime Statistics
Problems can come up in production. When they do, you usually want forensics that show aspects of the system under load, over a period of time.
Of course, you don’t want the collection of such data to affect performance. What’s needed is a mechanism to log data all the time, in a lightweight way, that can later be analyzed in productive ways. This system needs both built-in hooks at the Substance D framework level as well as extension points to analyze function points in the application you are writing.
Three components are involved in the process of collecting statistics:
substanced.statsexposes Python API to collect data and sends it to to a StatsD <https://github.com/etsy/statsd> agent- The StatsD agent aggregates data and sends it to backend service
- A backend service displays graphs based on stored data. The service can be self-hosted such as Graphite or it can be a SaaS solution such as DataDog.
Setting Up
To enable statistics gathering in your site, edit your .ini configuration
file and add the following lines to your [app:main] section:
substanced.statsd.enabled = true
substanced.statsd.host = localhost
substanced.statsd.port = 8125
substanced.statsd.prefix = substanced
Using DataDog with SubstanceD statistics
Substance D supports DataDog, a Software-as-a-Service (SaaS) provider for monitoring and visualizing performance data. DataDog installs an dogstatsd agent for sending custom metrics on your local system. The agent is based on StatsD.
Using DataDog is an an easy way to get started with Substance D statistics. Sign up for an account with DataDog. This will provide you with the instructions for downloading and running the local agent. You’ll need to get the agent installed before proceeding.
Once you’ve got the agent installed, and the proper settings in your Substance
D ini file, you will be able to see statistics in the DataDog user interface.
Once you log into your DataDog dashboard, click on Infrastructure and
you’ll see any hosts configured as part of your account:
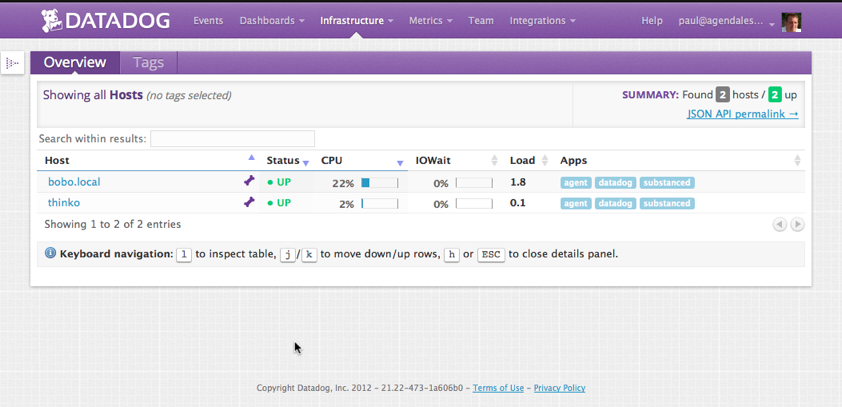
The substanced entry in Apps table column is from the
substanced.statsd.prefix configured in Settings up section. Clicking on
that brings up Substance D specific monitoring in DataDog:
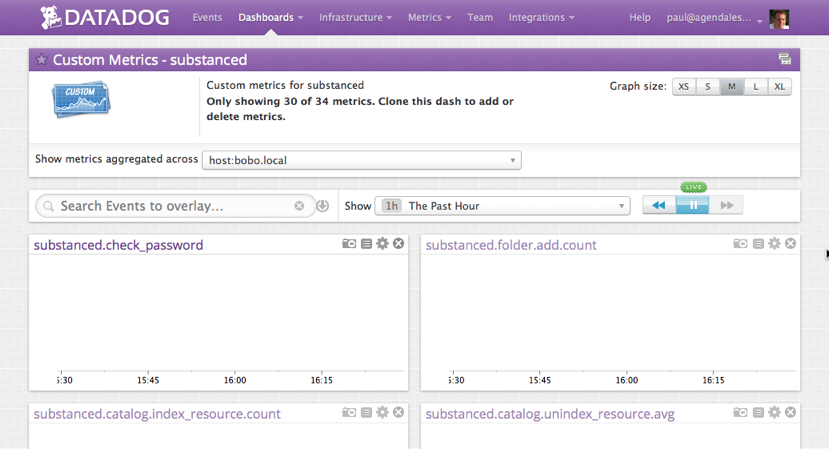
Clicking settings symbol on a graph will lead you to graph editor, where you can change how DataDog interprets and renders your graphs. A good resource how the editor works is Graphing Primer.
DataDog also supports Metric Alerts allowing you to send alerts when your statistics reach certain state.
Logging Custom Statistics
Over time, Substance D itself will include more framework points where statistics are collected. Most likely, though, you’ll want some statistics that are very meaningful to your application’s specific functionality.
If you look at the docs for the Python statsd module you will see three main types:
- Counters for simply incrementing a value,
- Timers for logging elapsed time in a code block, and
- Gauges for tracking a constant at a particular point in time
Each of these map to methods in substanced.stats.StatsdHelper. This
class is available as an instance available via import:
from substanced.stats import statsd_gauge
Your application code can then make calls to these stats-gathering
methods. For example, substanced.principal.User does the
following to note that check password was used:
statsd_gauge('check_password', 1)
Here is an example in substanced.catalog.Catalog.index_resource() that
measures elapsed indexing time inside a Python with block:
with statsd_timer('catalog.index_resource'):
    if oid is None:
        oid = oid_from_resource(resource)
    for index in self.values():
        index.index_resource(resource, oid=oid, action_mode=action_mode)
    self.objectids.insert(oid)